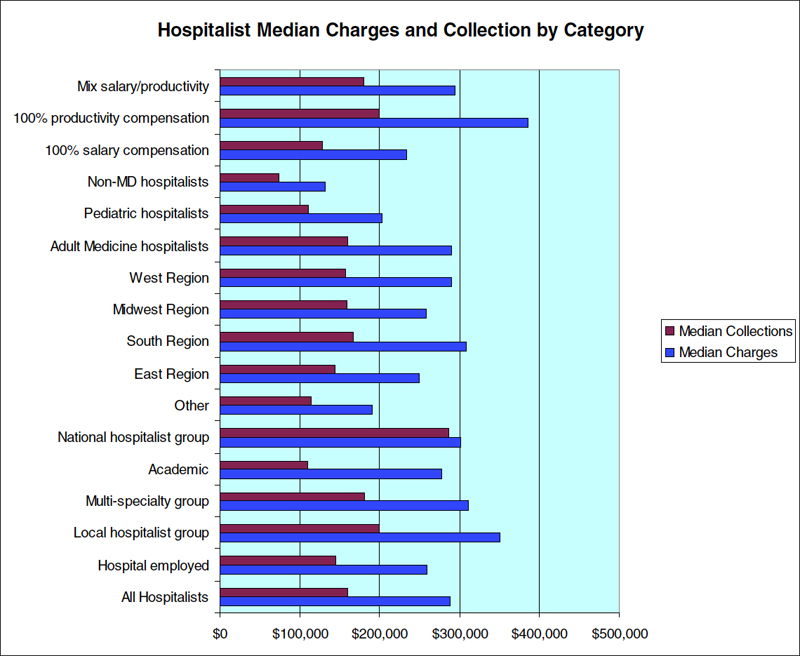
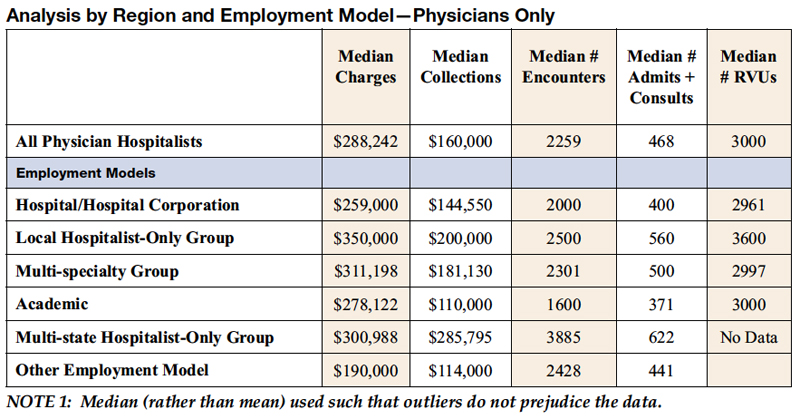
This chapter looks at work generated by the surveyed hospitalists. Overall, the median charges per year for physician hospitalists are $288,242 and the median collections are $160,000 (a 56% collection rate). The typical surveyed physician had a median of 2,259 encounters, 468 admissions and consultations, and 3,000 RVUs. The analyses below examine these measures from the following perspectives: region, employment model, specialty/provider type, and compensation model.
- Consistent with the compensation and productivity input measures, academic hospitalists have low median collections ($110,000 vs. $160,000 overall), low encounters (1,600 vs. 2,259 overall), low admissions and consults (371 vs. 468). However, academic hospitalists generate an equivalent number of RVUs (3,000) indicating that they are delivering more complex services. NOTE: At 40% ($110,000/$278,122), the median collection rate for academic groups is the lowest of all employment categories. This may be explained by the payer mix at academic medical centers.
- Hospitalist-only groups, both local and multi-state, generate the most work output. With regard to median charges generated, local groups are 21% higher ($350,000 vs. $288,242) and multi-state groups are 4% higher ($300,988 vs. $288,242). Hospitalists in multi-state groups have remarkable performance with regard to collections, achieving a 95% collection rate compared to a overall average of 56%. These hospitalist-only groups also have much higher encounters, admissions/consults, and RVUs.
- As in the Productivity Inputs, Eastern hospitalists have the lowest measures of Productivity Outputs. Hospitalists in the Southern region generate the most work in all five categories of outputs.
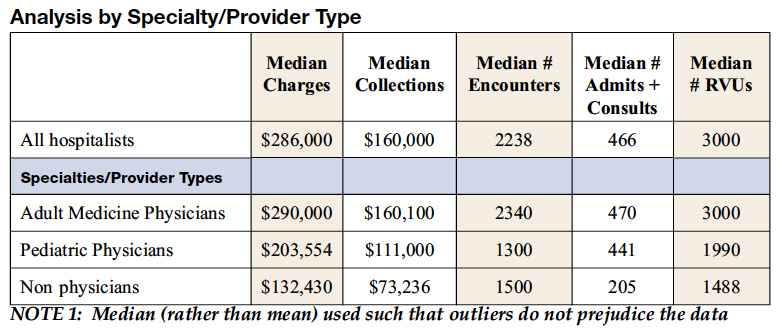
- Compared with adult medicine hospitalists, pediatricians generate fewer charges ($203,554 vs. $290,000), collections ($111,000 vs. $160,100), encounters (1,300 vs. 2,340), admissions/consults (441 vs. 470), and RVUs (1,990 vs. 3,000).
- Non-physicians generate about half the charges, collections, admissions/consults, and RVUs of physician hospitalists.
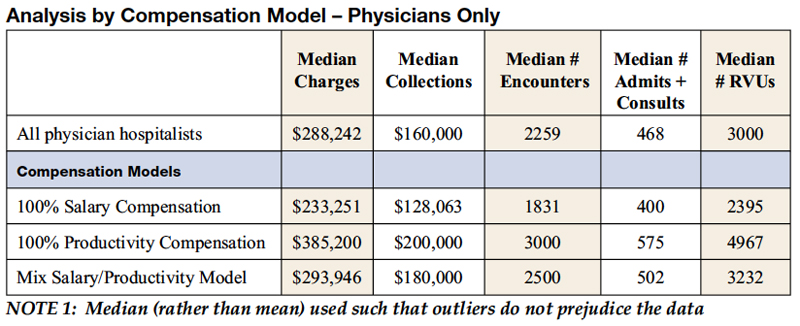
- Productivity–based compensation appears to have a positive impact on Productivity Output (the incentives appear to work).
- Compared with hospitalists with a 100% salary model, hospitalists that have a 100% productivity model have median charges 65% higher ($385,200 vs. $233,251), median collections that are 56% higher ($200,000 vs. $128,063), encounters that are 64% higher (3,000 vs. 1,831), admissions/consults that are 44% higher (575 vs. 400), and more than twice the median number of RVUs (4,967 vs. 2,395). In all cases hospitalists with a mixed compensation model fall in the middle of the two medians.
click for large version
click for large version
click for large version
click for large version
click for large version
click for large version
click for large version
click for large version